

Highlight for enterprise IT Managers
It’s a familiar cycle: you sign a contract with a service provider with promises of ultra-reliable connectivity, the latest technological innovations and first-class customer service – only to be met with intermittent problems, long-winded support procedures and unaware account managers.
It may seem that all service providers are the same, with little to differentiate between them, but there is a solution that puts some providers head and shoulders above the rest –
HM Network use the The Highlight Service Assurance Platform, an optional value add service which gives us and our end customers visibility of network health and more.
Do you trust your network service provider?
See what’s working and what isn’t with the Highlight platform
Our Highlight Service Assurance Platform is a cloud-based app specifically created for the provider-customer relationship. Through its service-assurance architecture, Highlight continuously and imperceptibly collects data from the connections in your network service and categorises them in an appealing and easy-to-understand web portal.
A fully featured reporting suite ensures both real-time and historical metrics are available for your organisation and your service provider, making sure all conversations start from a shared basis of understanding.

Bypass the support ticket run-around
If a problem does occur, Highlight can automatically alert designated people. The platform’s clear and intuitive Heat Tiles let you and your Service Provider see where the point of failure is, what kind of problem is occurring and how long the issue has been ongoing – eliminating the need to convince multiple unaware operations team members and service managers to carry out targeted investigative monitoring and allowing your organisation to plan responses appropriately.

Have conversations based on real data
Highlight gives users access to performance data that service providers would normally have to rely on busy technical operations teams to obtain, something usually reserved for a select few customers. This allows for better-informed conversations with your service manager and means that decisions on service optimisation come from real data. It also enables self-sufficient internal reporting, supporting budget and upgrade requests to management with real-world performance metrics.

Know your network with Enhanced Reporting & Alerting
Modern networks are complex, and with new SD-WAN technology being added to many networks that complexity will only increase in the future. Highlight has over twenty years of experience in making complex networking data simple and easy to understand. through having a thorough understanding of both the networking technology but also how that translates into the service being consumed by the end customer.
This combined knowledge results in the Highlight Service Assurance Platform only showing the most important information at any given moment, reducing the time and knowledge needed to get to the bottom of an issue and solve it.
Simple visualisation also has an added benefit, speed. Highlight’s user interface is incredibly fast, even at scale, with tens of thousands of services being watched. If you’re under pressure in the middle of a service outage you need clear information fast, Highlight has your back.
Get instant understanding of service performance at the detail level of your choosing
Heat Tile visualisation
Highlight’s unique heat tile is the primary starting point for real-time network status assessment in our service assurance platform. At a glance, you can see if there is a problem by the colour of the tile and if that problem is related to the stability, load or health of the service. You can also quickly see how long the problem has been going on for, and if it’s getting better or worse.
Large networks are likely to have many tiles, so this view can be filtered to only show tiles with problems, and, if required, further filtering can be applied to focus on just stability problems. In this view, Highlight is often used on a large screen as a wallboard.
Service and location tiles
Highlight’s heat tiles come in two forms, one representing a customer site called a Location Tile, the other representing a collection of common services called a Service Tile.
 Location Tiles are focused on services at a given location, Service Tiles typically represent many services over many locations and they can be especially helpful if you want a quick summary of how all Broadband or cellular services are running, or if an application performance test is failing over many locations.
Grid View
Highlight’s Grid View is an extension of location tiles and unpacks one or many locations into their common constituent parts and displays them in Underlay, Overlay and LAN category column groups.
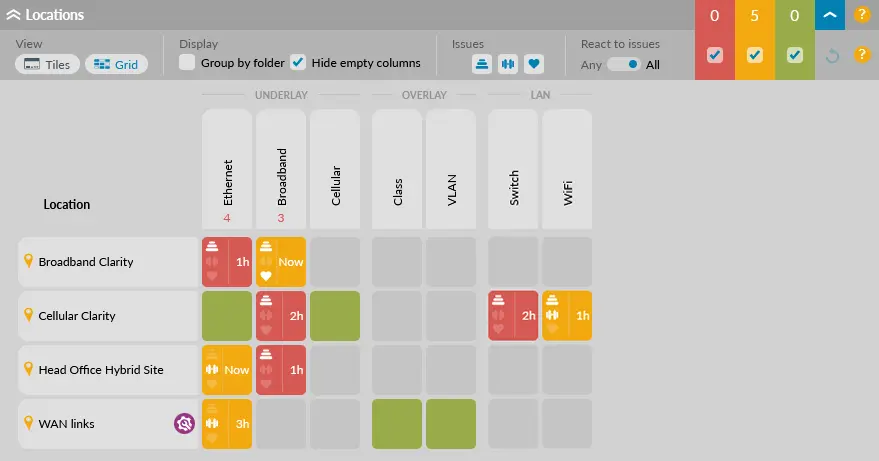
With the status of these components displayed as a grid, you can scan across a location row to see, at a glance, the status of a range of services at a location, or scan down a column to see the status of common services over many locations. This view provides is a quick and easy way to isolate the source of problems for service optimisation.
Details page
Once a problem has been identified with a given service, Highlight’s details page is where the important information can be found on why the problem occurred. Highlight’s clean and simple design philosophy continues here, with charts and graphs carefully designed to tell a story using colours and iconography that can be understood by any user.
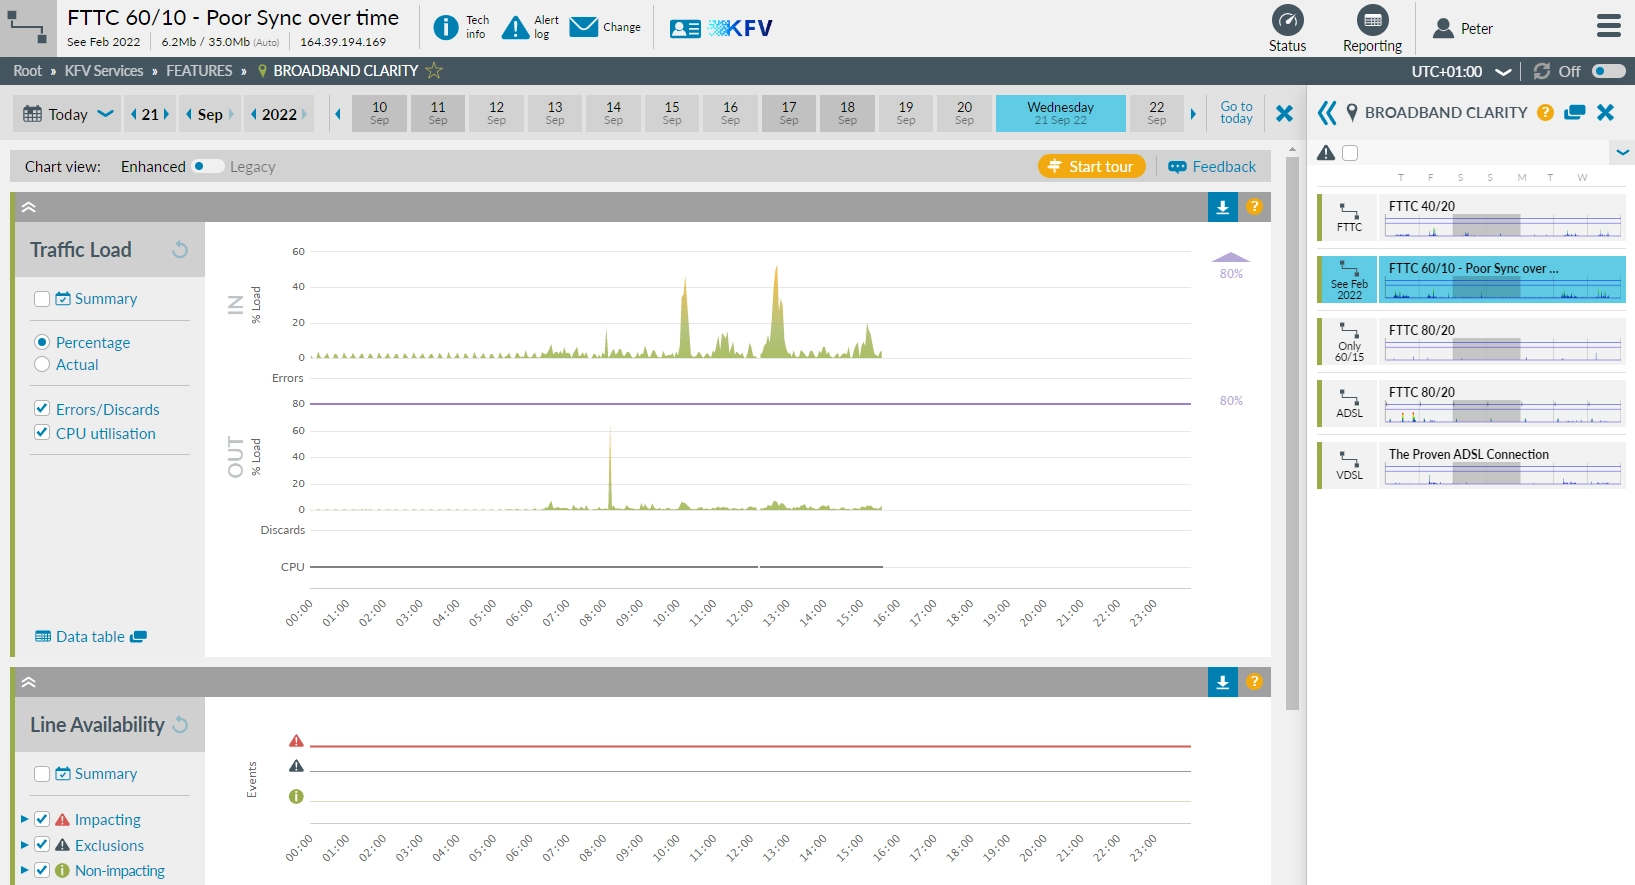
Time zones
To cater for international networks and users, information on the details page can be displayed in one of three different time zone options with a drop-down to switch between them
Customisable alerting
Monitoring and alerting are a fundamental part of any managed network service, but a critical part of alerting is ensuring the alerts are efficient and effective at raising awareness of a problem without overloading the team receiving the alert. It’s very common for technical monitoring tools to generate ‘alert storms’ and false positive alerts which overwhelm an operations team and result in monitoring on important services being disabled to reduce the workload.
You decide what’s high priority
The Highlight Service Assurance Platform has a uniquely advanced but easy-to-use alert sensitivity and filtering system that enables you to simply tune how quickly it responds to issues. For example, you can set sensitivity high for stability issues on critical network services, while reducing sensitivity on load, which is only a problem if it happens for a long time.
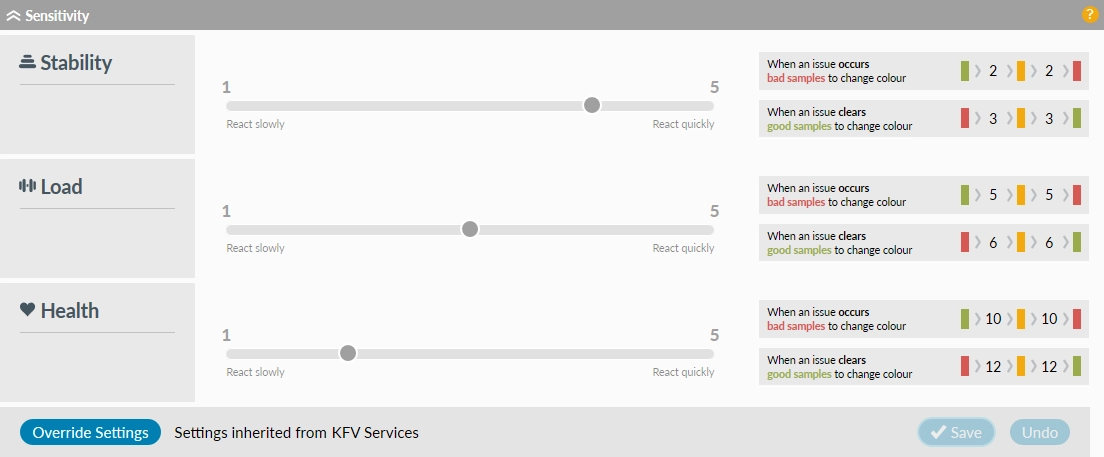
Highlight alerting can also be tightly integrated with any external IT service management tool through either email or webhook-based alerts. With the Highlight platform, you’re the first to know if there is a problem that needs fixing.
Flexible unified reporting
On-demand and scheduled reports are a core feature of Highlight covering summarised data going back a minimum of 500 days. On-demand reporting, available to all users, is fast and on-screen in seconds regardless of the size of network, or alternatively scheduled reports can be emailed to any number of recipients on a daily, weekly, or monthly basis.

Highlight reports can include automated analysis, making preparation for service reviews between provider and enterprise faster and more accurate. Availability figures show how each watch performed against the Service Level Agreement (SLA) with maintenance periods already excluded.
Business hours
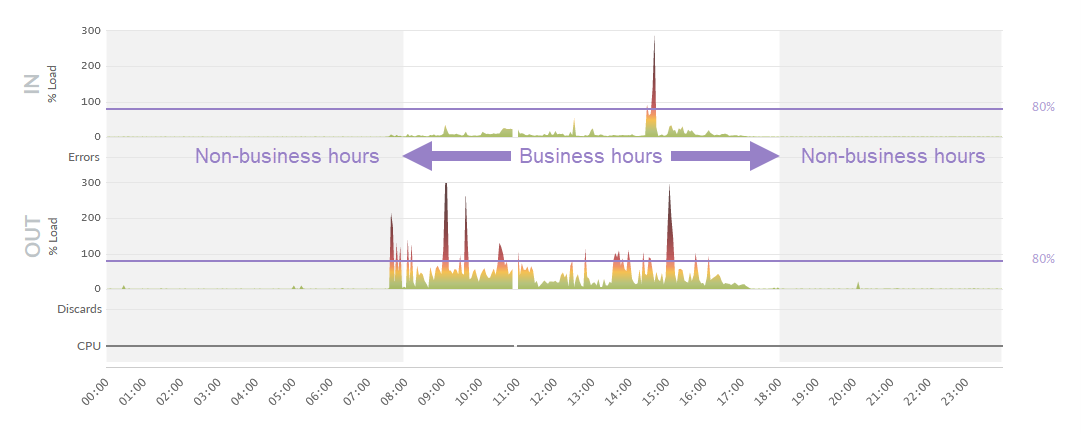
Highlight provides the option to use business hours when displaying traffic trend graphics, for filtering report results, and when generating alerts. This is a powerful way to control Highlight reporting so that calculations and values are based on times when the location is actually working and reliant on the network, rather than being skewed by overnight behaviour.
SLA now
Unlike other cloud or on-premise services that often require you to transpose your data from one system to another, Highlight continuously strives to make the measuring and monitoring of services quick and easy to view and report on.
Having a shared, unbiased and transparent single source of service performance enables us and our customers to have the same understanding of issues and thereby work on improvements to ensure the service performance meets or exceeds expectations.
Inventory
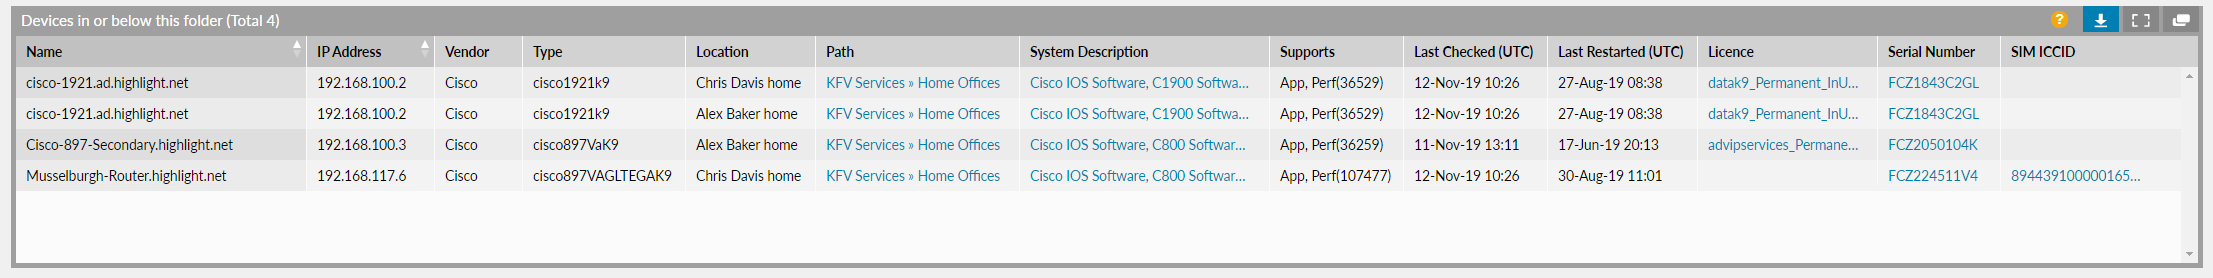
The inventory page in Highlight is a table listing device details gathered directly from the device and updated every four hours. This contains accurate data across an entire estate including, IP address, vendor, type, licence, serial number, last restarted date/time and more. This data can be used for reconciliation in Finance teams or to check software versions by Operations teams.
